In any scientific project – particularly in chemistry and formulation sciences- experimental data is a fundamental output. This data forms the basis for analysis, interpretation of results, and increasingly, for training AI models. However, to truly leverage its value, one must first understand the broader context in which the data is generated: the design space. This refers to a conceptual, often multidimensional framework that defines the boundaries, variables, and conditions under which experiments are planned and executed. It is within this space that scientific exploration takes shape, guiding both discovery and decision-making.
f o u n d a t i o n s
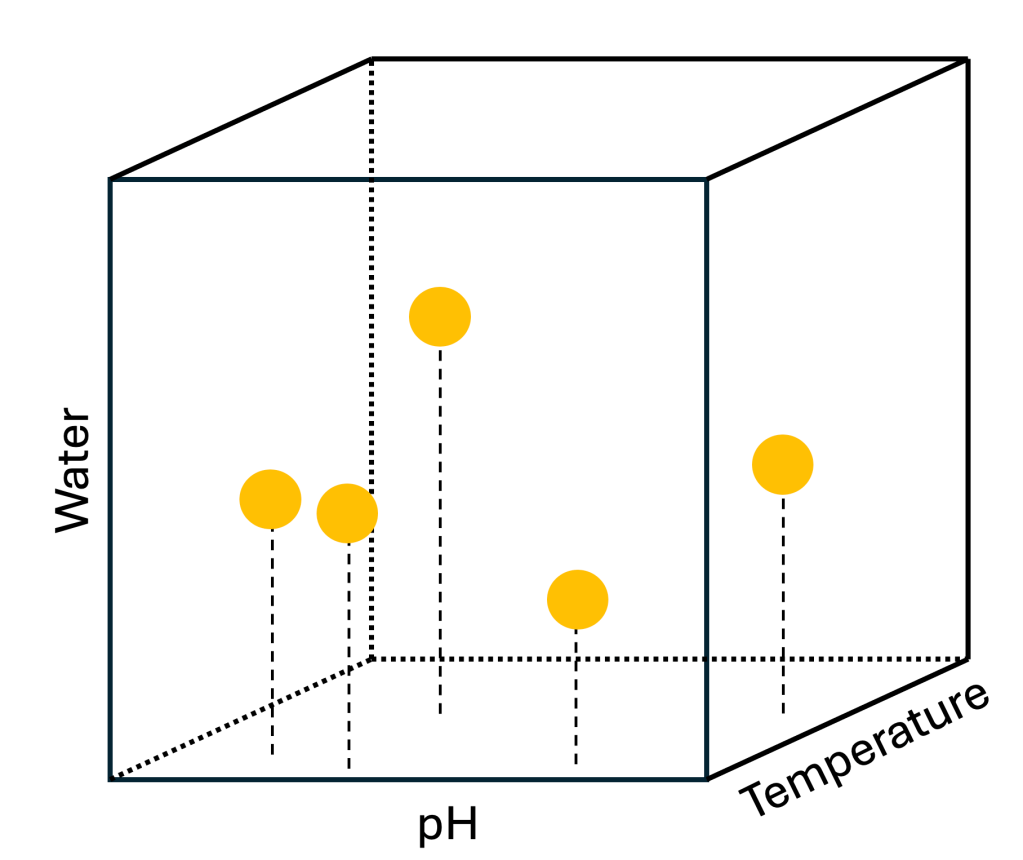
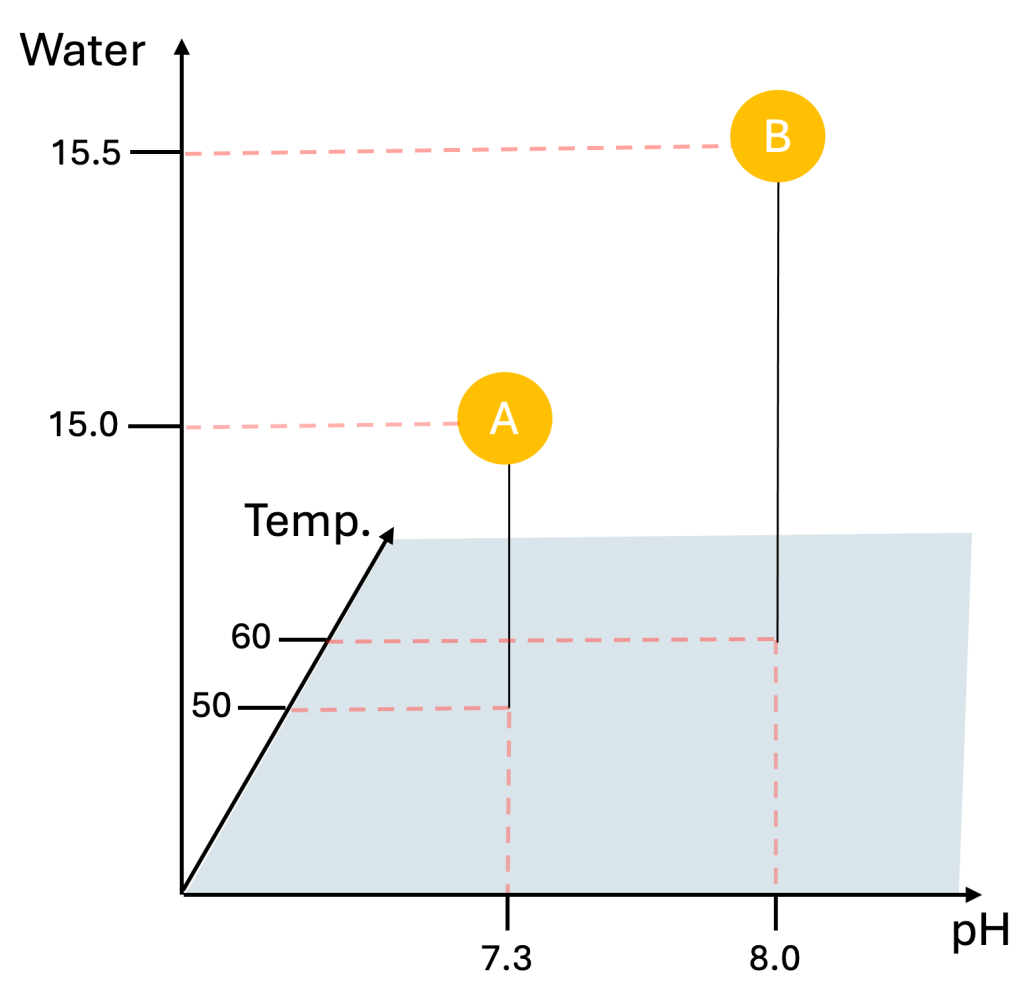
The design space is fundamentally a mathematical construct (and yes -apologies in advance, a few formulas might be involved). Each data point within this space corresponds to a specific set of parameter values, effectively mapping the experiment to a unique coordinate in a multidimensional landscape. For example, consider a simple experiment defined by just three parameters: pH, water volume, and temperature. Every experimental run can be represented as a point in a three-dimensional space, with its position determined by the specific values of those parameters.
As more variables are introduced, the design space becomes increasingly complex – yet it remains a powerful way to conceptualise and structure scientific investigation.
Every design space is characterized by a few key properties:
- Boundaries: These define the size and shape of the design space by specifying the minimum and maximum allowable values for each parameter. Boundaries can be dictated by the physical nature of the variables (e.g., temperature cannot be negative in certain systems), inherent scientific limitations, or practical constraints in experimentation (such as instrument range).
- Step size: This refers to the increment by which a parameter is varied within its boundary. Step size determines the resolution of exploration within the design space – a smaller step size provides finer detail but requires more experiments. Step size can also be limited by the physical nature of the variable (e.g., no change in experimental result would be expected if the temperature increment is 0.001 °C).
r e s p o n s e
One essential piece in the broader definition of the design space is the response. The response is the outcome or result of an experiment, typically measured and recorded as either a numerical value (e.g., yield, particle size, viscosity) or a categorical outcome (e.g., pass/fail, stable/unstable). While the design space defines the inputs – the parameters we control – the response captures the output, allowing us to evaluate the impact of different parameter combinations. More importantly, experiments may contain more than one response, thus forming a response space. Equally to the design space, the response space is a mathematical construct where each experiment is mapped based on its response values.
For simplicity, let’s consider a case with a single response – say, yield. In this scenario, each experiment is mapped not only by its input parameters, but also by its corresponding response value. The response surface can be imagined as a continuous function that spans across the defined design space. (Yes, it’s a bit of a confusing term – ‘response space’ sitting within the ‘design space’ – but stay with me.)
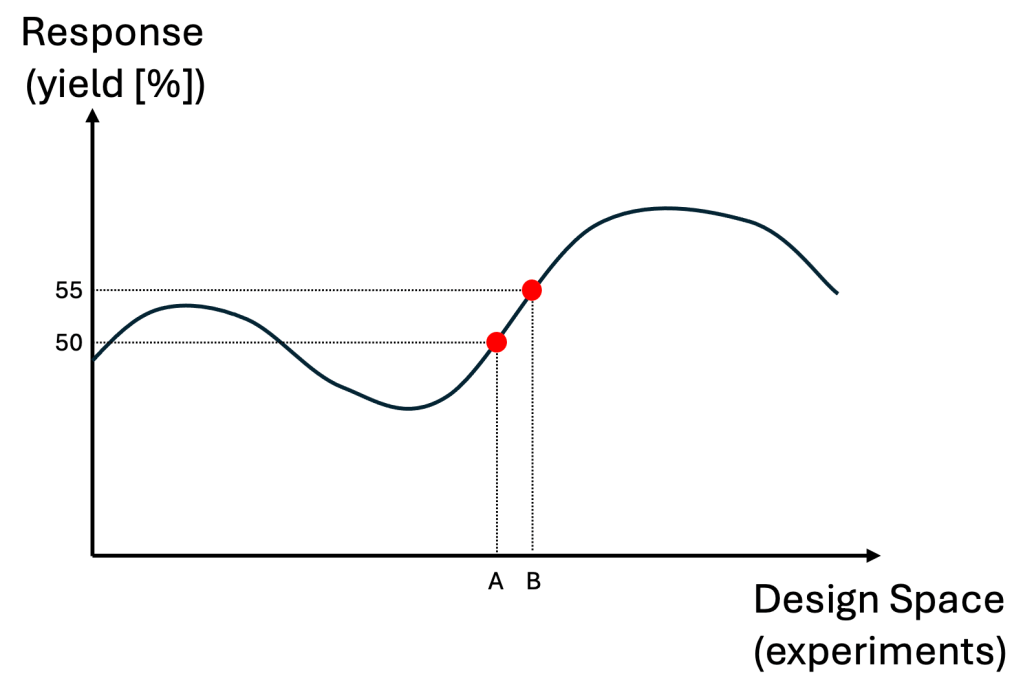
Now, imagine performing every possible experiment defined by your parameter boundaries and step sizes. You’d essentially be evaluating the entire design space, and each combination would return a response value. Visually, this would produce a surface (or curve, in lower dimensions) that represents how the response changes across different parameter settings.
In mathematical terms, this relationship is described by a function:

Here, 

m i n d s e t
Conceptual understanding is crucial, especially for us humans, because it allows us to visualise and reason about abstract ideas like the design space. When we mentally picture the design space as a landscape with peaks, valleys, and contours representing the response, we begin to approach experimentation not as a series of isolated trials, but as a journey through a structured environment.
This shift in mindset has profound implications. Instead of simply testing conditions at random or based on intuition, we begin to ask: What region of the space am I in? How might a small change in one variable move me along the surface? Am I climbing toward a better response, or descending into less desirable outcomes?
In this way, a strong conceptual grasp of the design space doesn’t just support better analysis – it shapes the way we design, plan, and interpret experiments, allowing for more informed decision-making, deeper insights, and ultimately more efficient scientific discovery.

During my PhD, I came across a citation by geographer Waldo Tobler, whose First Law of Geography states:
Everything is related to everything else, but near things are more related than distant things.
W. Tobler
Though originally meant for geographic systems, this idea has deeply influenced how I think about design spaces in experimental science. In a way, Tobler’s law maps intuitively onto our understanding of response surfaces. Nearby points in the design space – experiments with similar parameter values – are likely to produce similar outcomes. As you move further away, the behaviour may begin to diverge.

This makes me think of the design space as a kind of map – a landscape that we gradually explore and uncover through experimentation. Each experiment is like stepping into uncharted territory, revealing a small piece of the terrain. With every new data point, we illuminate previously unknown regions, discover unexpected peaks (optimal conditions), and sometimes encounter valleys or cliffs (undesirable outcomes).
